
hercules is a tool for fast, insightful and highly customizable Git history analysis: it replays a repository’s entire commit history in a single pass and extracts analyses from it — project burndown, code ownership, churn, coupling, bus factor, structural hotness, and more.
A revival
The original src-d/hercules was left behind when the company behind it wound down. My fork brings it back to life: a modernized Go toolchain, working CI, a GitHub Action, analysis presets, caching, and a stream of fixes and new analyses on top of the original engine.
Eating my own dog food
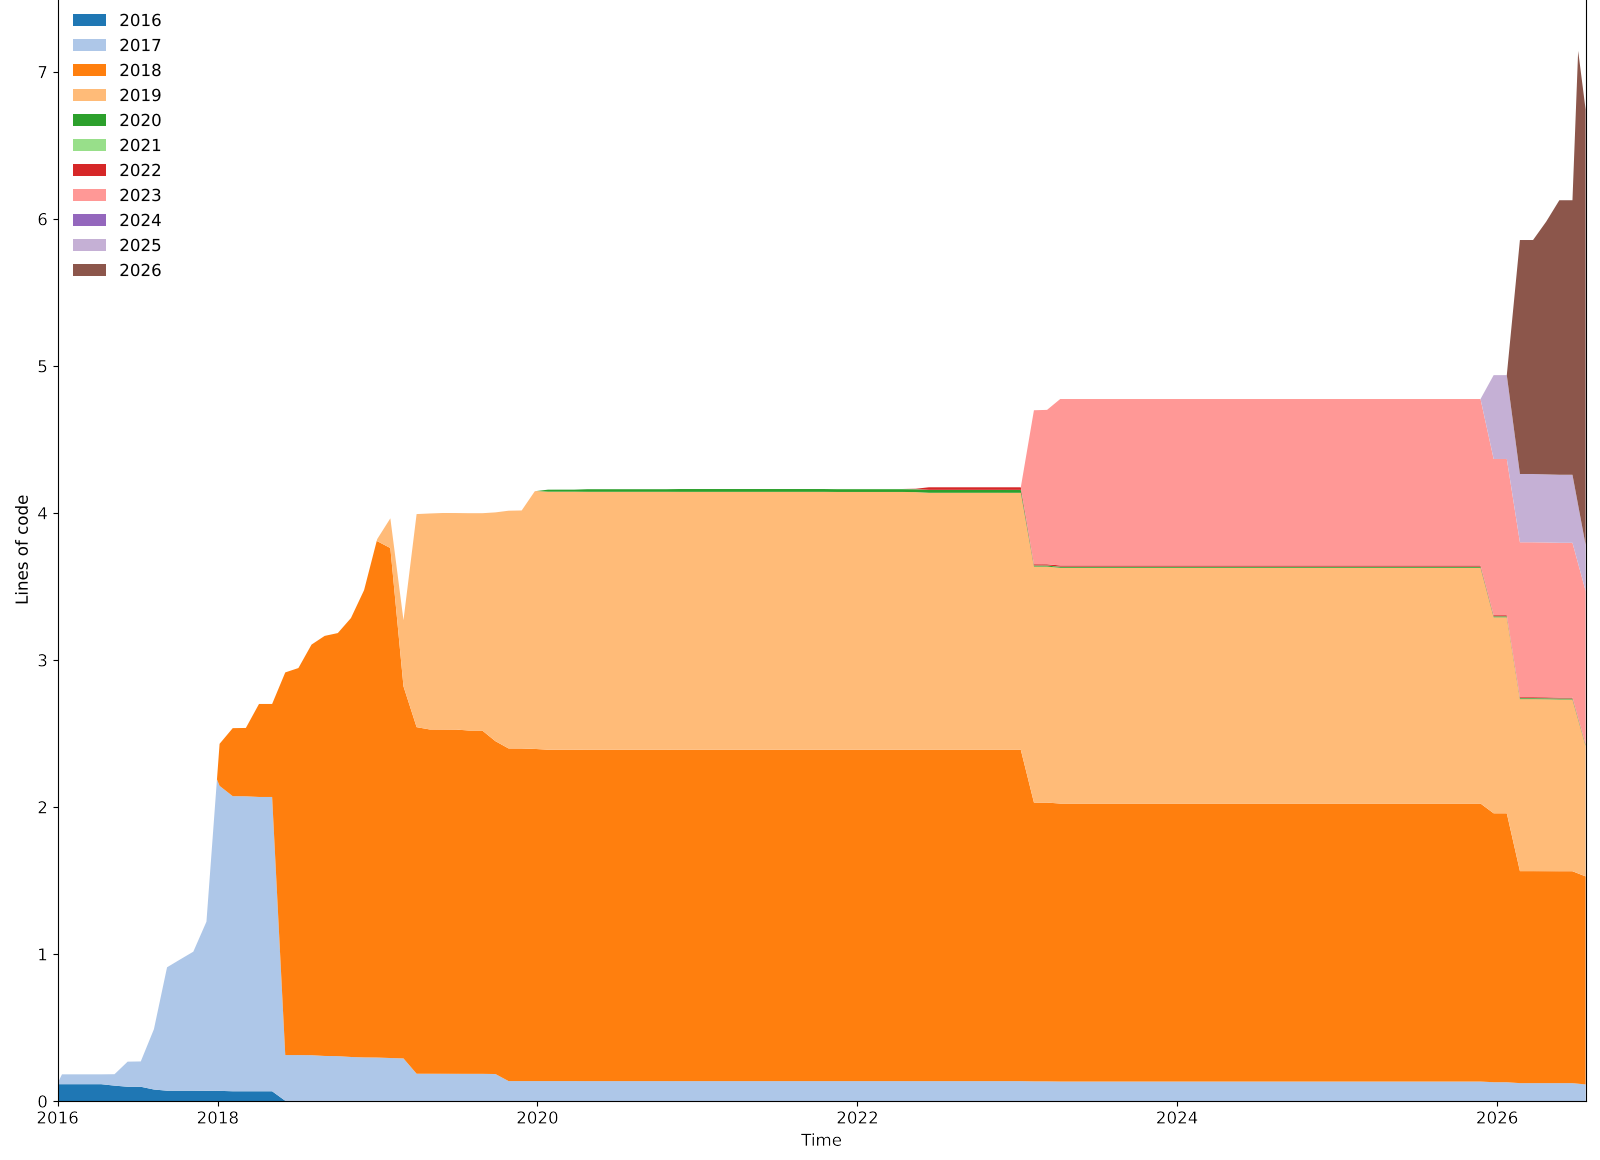
The plotting side is where my projects converge: charts are rendered through matplotlib-go, my own plotting library, and labours-go reimplements the original Python companion tool in Go. The chart below is hercules analyzing its own repository — ten years of history, including the point where the revival begins:
How to read a burndown
A project burndown answers one question: of all the code in the repository at a given moment, when was each line last edited? Every coloured band is one quarter, and its thickness on a given date is the number of lines last edited in that quarter that are still alive on that date. Stacked, the bands add up to the size of the whole codebase — the 1e4 marker above the y axis means the scale is tens of thousands of lines, so the peak here is a little over 80,000.
The asymmetry is what makes the shape informative: code only ages. Once a quarter has passed, its band can never grow again — it can only shrink, as those lines are deleted or rewritten, and whatever replaces them enters at the top of the stack, in the band of the quarter that did the rewriting. So a vertical slice tells you what the codebase consisted of at that moment, sorted by age; following a single band from left to right tells you how long that quarter’s work actually survived.
A few shapes are worth looking for:
- A wide, flat band — code written once and never touched again: stable foundations, or the parts nobody dares to change.
- A band that thins quickly — work superseded soon after it was written. Churn rather than accumulation.
- A step down across the whole stack — a mass removal: a vendored dependency dropped, a subsystem deleted, generated files taken out of the tree.
- A long stretch with no new colours — dormancy. Nothing was edited, so nothing aged into a new band.
This chart has two of those in plain sight. The plateau from 2019 to 2022 is the dormancy after src-d wound down — years in which the codebase barely moved. The climb from 2023 onwards is the revival, each quarter of new work entering at the top. And the thin bands still running along the bottom in 2026 are the original code from 2017 and 2018 that has outlived every rewrite since. The idea, and the term, come from Erik Bernhardsson’s half-life of code.
The same burndown, by author
Change one thing about the chart above — band the surviving lines by who last touched them instead of when they were written — and the same analysis answers a different question: whose code is still standing?
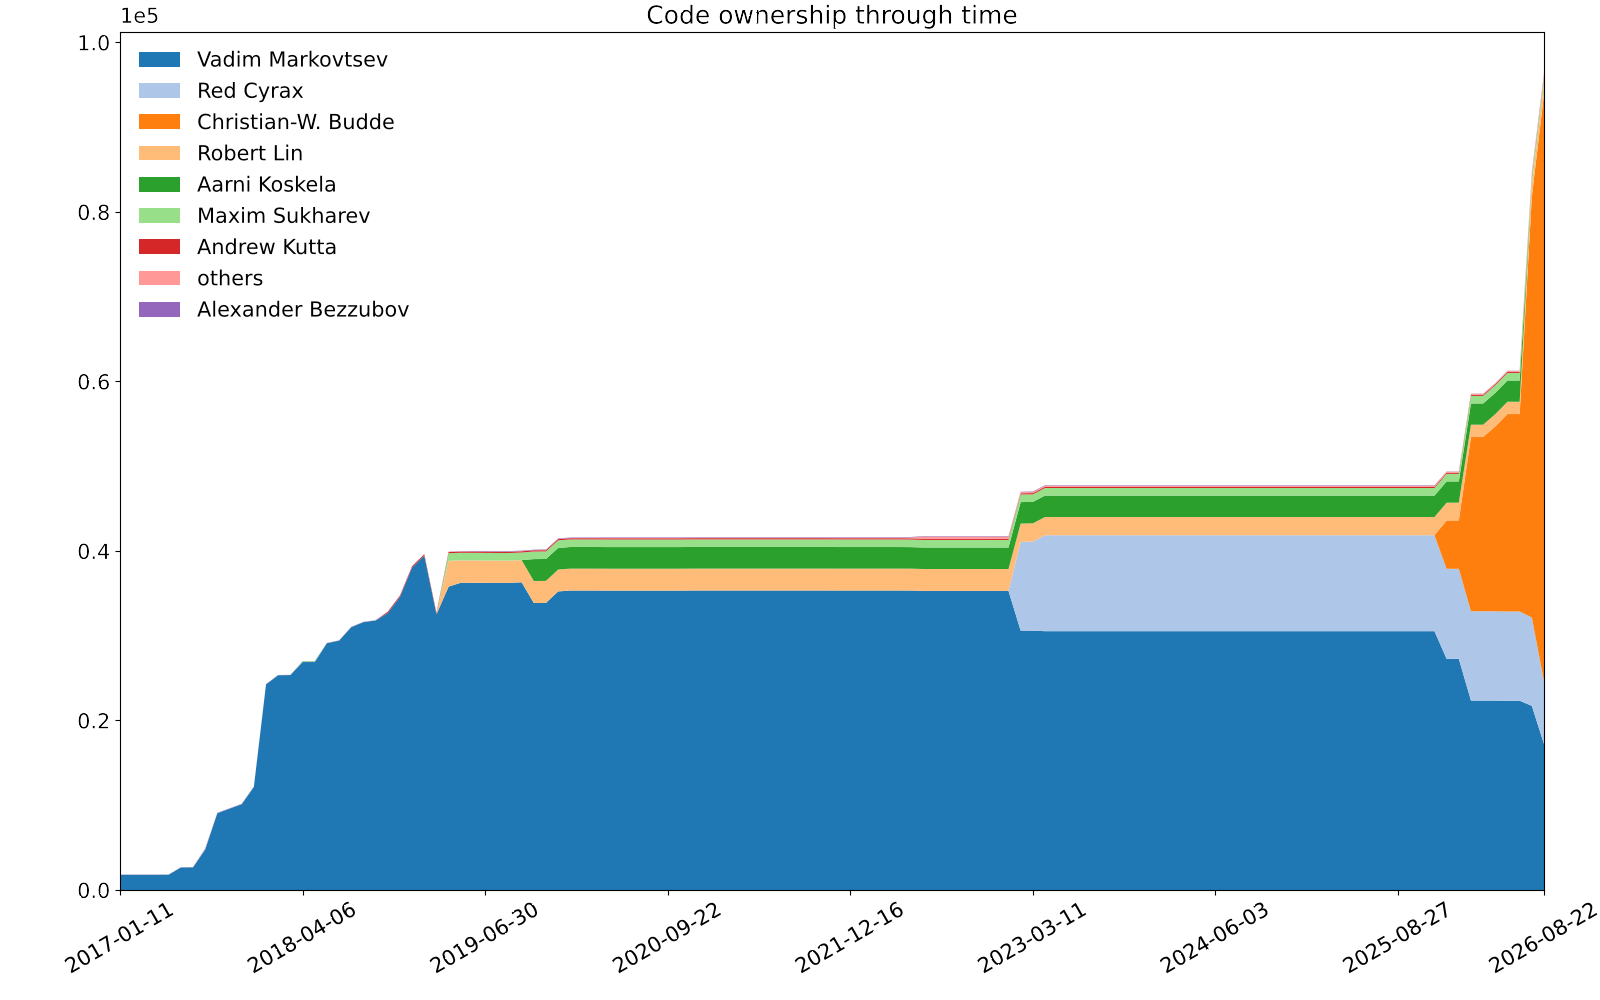
The same rule applies as before: a band can only grow while that person is committing, and everything after that is attrition. The 1e5 marker means the stack tops out just under 100,000 lines. Everyone past the eighth-largest contributor is folded into a single “others” band.
Vadim Markovtsev, who wrote the original at src-d, peaks at around 39,000 lines in early 2019 and then simply holds: at the end of 2022, three years after his last sustained burst of work, he still owns 85% of the codebase. Nobody had rewritten it, because nobody was working on it — that is what four dormant years look like from the ownership side, and it is the same plateau the project burndown shows, attributed rather than dated.
What follows is attrition, not deletion. His share falls to 64% in 2023 and to 18% by mid-2026, because the code was replaced — and a replaced line counts for whoever replaced it. The orange band that takes over is the modernization: it did not exist in January 2026 and accounts for just over 70% of the codebase by that August, as subsystem after subsystem gets rewritten rather than patched.
Two caveats, since both charts sit on the same page. The project burndown above is smoothed with a 45-day rolling mean, which flattens the sharp growth at the very end, so it reads lower than the roughly 96,000 lines this chart ends on — same repository, same analysis, different filter. And identities have to be merged by hand: contributors show up under every name and address they ever committed with, so without a mapping this chart would split one person into four.