
matplotlib-go is a plotting library for Go inspired by Matplotlib: renderer-agnostic at the core, with high-quality raster backends today and vector/GPU backends planned.
A long-standing itch
It scratches an itch I have had since the measurement era — the VST Plugin Analyser exported stacked plots to PNG and SVG back in 2008, and I have wanted a proper, general plotting foundation ever since. The rendering layer underneath is agg_go, my Go port of Anti-Grain Geometry.
Examples
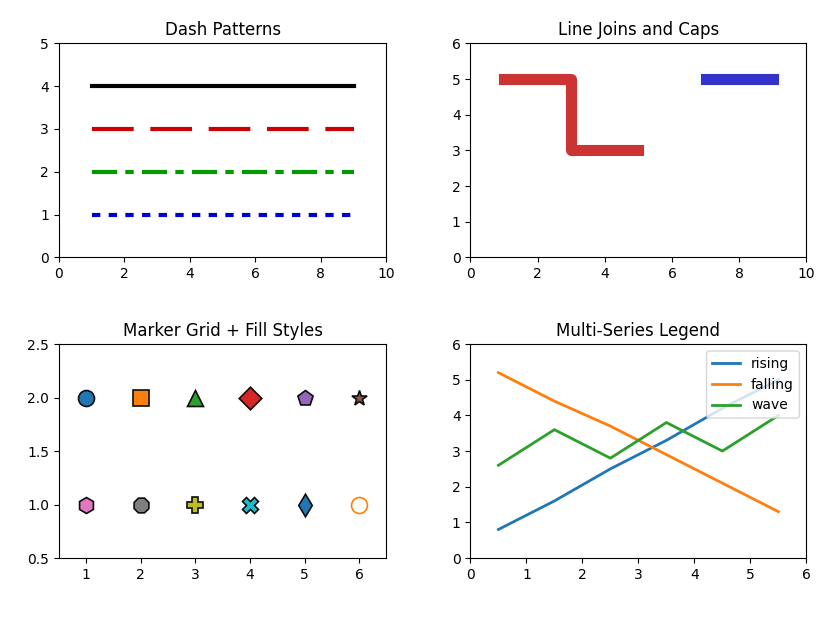
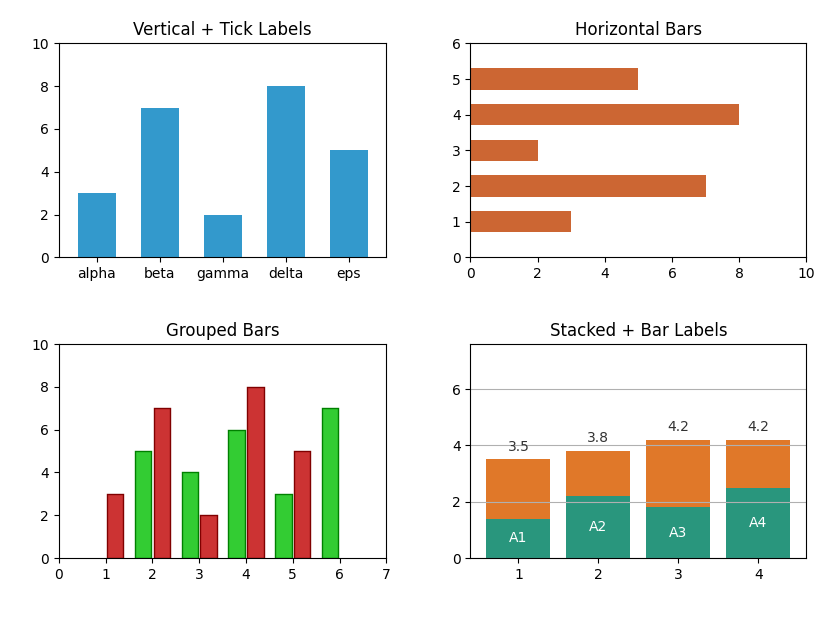
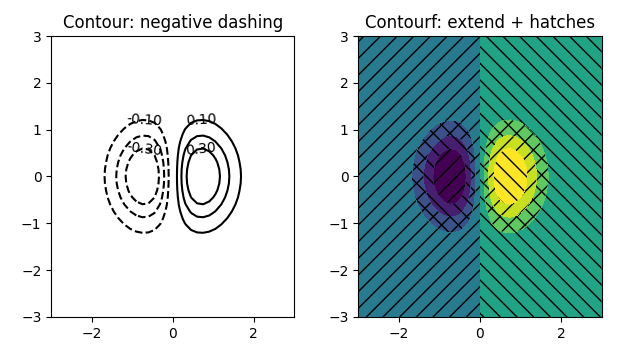
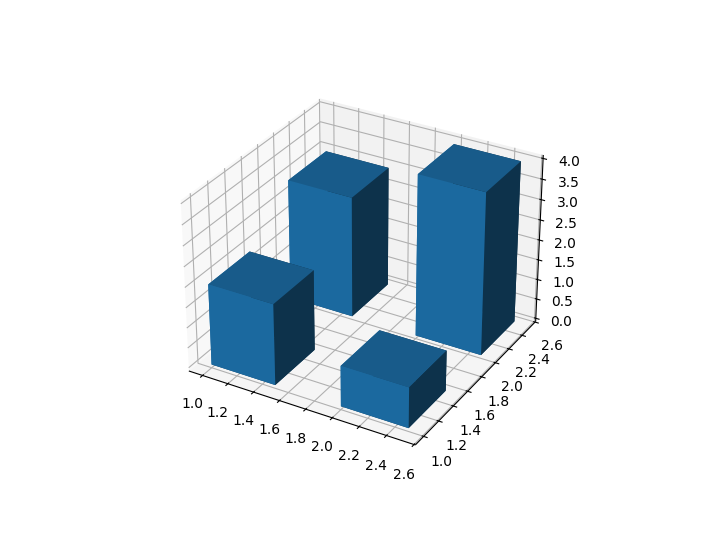
All plots below are rendered by matplotlib-go itself — and so is the live browser gallery, the same demo catalog compiled to WebAssembly:
The toolbox around it
A plotting library pulls a surprising amount of machinery behind it, so matplotlib-go grew satellites: mathtext parses and lays out Matplotlib-style MathText expressions, qhull-go is a pure-Go Delaunay triangulator reproducing Qhull’s connectivity, and Go-Clipper2 handles polygon clipping. Its most satisfying deployment so far: rendering the charts of hercules. More background is on the blog.